Technical analysis relies on the structured interpretation of historical price data, trading volume, and related market statistics to anticipate potential future price movements. Rather than focusing on corporate fundamentals or macroeconomic conditions alone, technical analysts examine patterns in price behavior to identify probabilities and shifts in momentum. Over the past two decades, the evolution of specialized trading software has transformed how this analysis is conducted. What was once performed manually on static charts is now executed through dynamic, data-driven platforms capable of processing millions of data points in milliseconds.
The best trading software tools for technical analysis combine robust charting engines, comprehensive market access, customizable indicators, backtesting functionality, and stable execution integration. These platforms serve a wide range of users, from individual retail traders to institutional portfolio managers and quantitative analysts. While the core principles of technical analysis remain consistent, software capabilities vary substantially, influencing workflow efficiency, analytical depth, and decision precision.
Core Functions of Technical Analysis Software
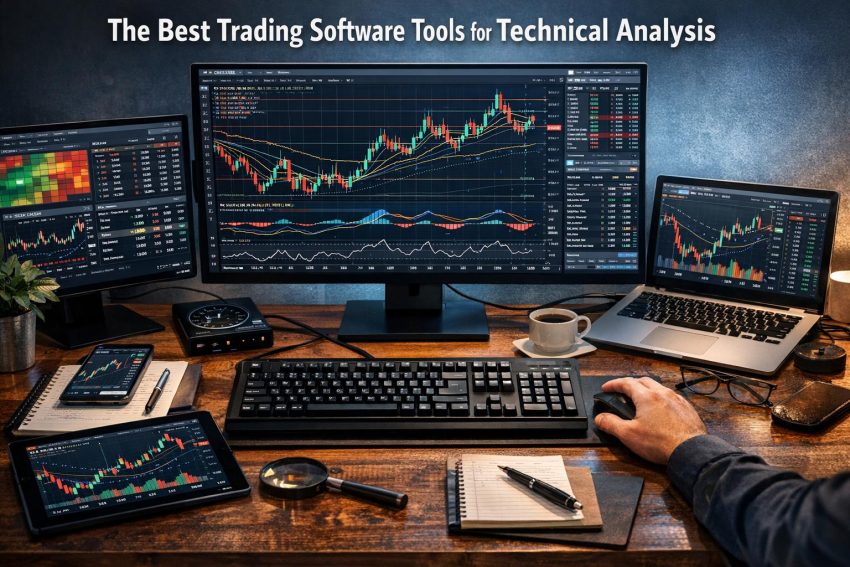
At its foundation, technical analysis software converts raw market data into organized visual and statistical representations. Charts form the central interface through which traders interpret information. Most platforms support candlestick charts, which visually illustrate open, high, low, and close prices; bar charts for more traditional analysis; and line charts for simplified trend identification. Timeframes typically range from one-minute intervals to monthly views, with some platforms allowing customized aggregation periods.
Indicators represent another essential component. Technical analysts apply momentum oscillators such as the Relative Strength Index (RSI), trend-following metrics like moving averages, volatility measures such as Bollinger Bands, and convergence-divergence tools including MACD. The flexibility to adjust parameters is crucial, as different markets and trading styles require variable settings.
Modern software also offers advanced drawing tools that enable manual identification of trendlines, Fibonacci retracements, price channels, and support and resistance levels. Computational advancements have introduced automated pattern detection capable of identifying formations like head and shoulders, double tops, triangles, and flags. While automation does not eliminate analytical judgment, it accelerates chart review and reduces oversight.
Another fundamental feature is backtesting. Robust backtesting engines allow traders to evaluate strategies against historical data to assess metrics such as profit expectancy, maximum drawdown, Sharpe ratio, and risk-adjusted return. Some platforms extend this further by supporting algorithmic trading, enabling rule-based systems to execute automatically once defined conditions are met.
TradingView
TradingView is among the most widely adopted platforms for technical analysis due to its accessibility and feature breadth. As a browser-based solution, it minimizes hardware dependency and provides consistent performance across devices. Its user interface emphasizes scalability and clarity, making complex multi-chart layouts manageable even for high-frequency monitoring environments.
Chart customization is extensive. Users can utilize Renko, Heikin-Ashi, Kagi, Point and Figure, and range-based charts alongside conventional time-based formats. The indicator library includes hundreds of predefined studies, and additional tools are contributed by the community.
A defining aspect of TradingView is Pine Script, a proprietary scripting language that allows traders to design custom indicators, alerts, and fully automated strategies. Pine Script supports multi-timeframe logic and conditional statements, enabling granular strategy construction. Backtesting results are presented visually on charts and in detailed strategy reports.
The platform covers equities, exchange-traded funds, forex pairs, cryptocurrencies, commodities, and indices. While data granularity depends on subscription tier, integration with numerous brokers allows trade execution directly from charts. For traders who prioritize visual clarity and cloud-based convenience, TradingView remains a central analytical tool.
MetaTrader 4 and MetaTrader 5
MetaTrader 4 (MT4) and MetaTrader 5 (MT5) are widely used in forex and contract-for-difference markets. Developed by MetaQuotes, both platforms emphasize algorithmic capabilities and industry-standard automation frameworks.
MT4 is recognized for stability and extensive third-party development support. It uses the MQL4 programming language, enabling traders to create Expert Advisors (EAs) that automatically execute trades. MT5 expands functionality to additional asset classes and introduces depth-of-market displays, improved strategy testing, and enhanced order management.
The integrated Strategy Tester allows both single-threaded and multi-threaded backtesting, depending on version. Users can optimize multiple parameters simultaneously to refine performance metrics. The availability of a global marketplace for indicators and automated systems significantly broadens functionality.
Although the interface appears less modern compared with browser-based alternatives, MetaTrader’s strength lies in computational reliability, extensive broker compatibility, and a mature ecosystem of algorithmic tools.
Thinkorswim
Thinkorswim offers a comprehensive analytical environment tailored to traders who require depth across equities, options, futures, and forex. Its interface is data-dense but highly customizable. Charting modules allow simultaneous multi-timeframe display and symbol overlays, enabling comparative analysis within a single window.
The proprietary ThinkScript language grants users flexibility to construct complex custom indicators and conditional alerts. Strategy testing tools provide hypothetical performance assessments across historical data. Unlike purely technical platforms, Thinkorswim integrates derivatives analytics, including implied volatility calculations and probability modeling.
The platform also offers simulated trading functionality, allowing users to refine technical strategies in a controlled environment. For traders who combine price action analysis with derivatives-based metrics, Thinkorswim supports cross-market evaluation within unified software.
NinjaTrader
NinjaTrader is especially prominent in futures trading and systematic strategy development. Its architecture is designed for performance-intensive tasks, including tick-level data analysis and multi-instrument optimization. The platform supports sophisticated order routing and advanced execution types.
Customization relies on C#-based scripting, which permits complex logic structures and data-handling routines. Traders can build automated systems from scratch or modify third-party tools available within its ecosystem.
The Strategy Analyzer module enables parameter optimization, walk-forward analysis, and Monte Carlo simulation. These features are particularly relevant for quantitative traders seeking statistically rigorous evaluation prior to deployment. Market replay functionality further supports training and strategy testing under simulated real-time conditions.
eSignal
eSignal is oriented toward active traders who prioritize high-quality real-time data. Institutional-grade data feeds reduce latency concerns and improve reliability for intraday decision-making. Its charting tools include a wide variety of indicators and allow layered comparisons across securities.
Scanning capabilities facilitate market-wide screening for predefined technical criteria. Traders can program alerts that activate when price meets specified conditions. eSignal’s strength primarily lies in data stability and execution integration rather than social or collaborative features.
TrendSpider
TrendSpider differentiates itself by automating traditionally manual aspects of chart analysis. It uses algorithms to generate dynamic trendlines and detect support or resistance zones based on objective criteria. This reduces variability arising from individual interpretation.
Automated multi-timeframe analysis overlays structural levels derived from different intervals, providing consolidated visibility. Scanning tools allow traders to monitor extensive watchlists for conditions involving specific patterns, indicator thresholds, or price interactions.
The emphasis on dynamic alerting enables traders to respond promptly to price interactions without constant manual supervision.
MultiCharts
MultiCharts caters primarily to systematic traders requiring extensive portfolio management capabilities. It supports both automated execution and discretionary charting. PowerLanguage scripting offers intuitive strategy development for those familiar with EasyLanguage syntax.
Backtesting is a central feature, with detailed performance reporting including risk-adjusted metrics and customizable cost modeling. Portfolio-level testing allows simultaneous evaluation of diversified strategies, accounting for cross-instrument interactions and capital allocation constraints.
MultiCharts also provides broker connectivity across global markets, enabling consistent infrastructure for multi-asset deployment.
Bloomberg Terminal
The Bloomberg Terminal integrates technical charting within a much broader research framework. Users can overlay macroeconomic indicators, corporate financial metrics, and cross-asset performance data onto price charts. Customizable studies allow traders to combine technical overlays with proprietary Bloomberg analytics.
Its primary advantage lies in data breadth rather than purely technical capability. Institutional users often employ Bloomberg as a centralized information hub, supplementing more specialized execution platforms with its analytical and screening power.
StockCharts
StockCharts emphasizes visual clarity and accessibility. The SharpCharts interface provides flexible indicator arrangements and annotation tools, while the Advanced Charting Platform offers interactive drawing and scanning functionality.
Although not designed for high-frequency algorithmic deployment, StockCharts supports structured equity analysis and watchlist management. Predefined technical scans assist traders in identifying securities that meet momentum or trend-based criteria.
Data Quality and Market Coverage
Data accuracy is fundamental in technical analysis software. Latency, missing ticks, and inaccurate corporate action adjustments can distort indicator calculations and backtesting outcomes. Platforms may source data directly from exchanges or through aggregators, and subscription levels often determine data granularity.
Coverage across asset classes is equally relevant. Traders focusing on forex or cryptocurrencies require continuous pricing streams without central exchange closures. Equity analysts may need detailed corporate event adjustments. Futures traders depend on rollover-adjusted continuous contracts for long-term studies.
Understanding data methodology is therefore essential prior to selecting a platform.
Backtesting Integrity and Optimization
Backtesting engines differ substantially in modeling depth. Simple platforms may assume immediate order execution at closing prices, whereas advanced systems simulate slippage, latency, and varying order types. Overlooking such factors can inflate hypothetical returns.
Advanced statistical techniques, including walk-forward optimization, out-of-sample validation, and Monte Carlo simulation, strengthen strategy assessment. While these processes increase complexity, they reduce overfitting risk by evaluating robustness under multiple parameter variations.
Broker Integration and Execution
Effective technical analysis software often integrates directly with brokerage infrastructure. This enables immediate order placement from charts and reduces operational friction. Execution speed, available order types, and risk management controls influence suitability for different trading strategies.
Some platforms operate independently from brokers, functioning primarily as analytical overlays. In such cases, traders must establish execution pathways separately, potentially increasing workflow complexity.
Web-Based Versus Desktop Platforms
Web-based platforms provide cross-device access and automatic updates. They reduce local maintenance requirements and typically synchronize layouts through cloud storage. However, performance may depend on server infrastructure and internet stability.
Desktop applications offer direct hardware utilization and often greater capacity for computation-intensive strategy testing. Algorithmic traders conducting large-scale historical optimization frequently prefer local installations for greater processing control.
Artificial Intelligence and Automation
Artificial intelligence integration is expanding within technical analysis software. Machine learning algorithms evaluate historical pattern distributions and suggest probability-weighted outcomes. Automated scanning systems can process thousands of instruments simultaneously.
Despite these advancements, AI-driven outputs remain dependent on historical training data and market conditions. They function as analytical supplements rather than deterministic predictors. Traders must continuously evaluate model performance under evolving volatility regimes.
Security and System Stability
Security protocols, including data encryption and multi-factor authentication, protect user accounts and strategy code. Platform outages or server latency can disrupt decision-making and execution. Assessing uptime statistics and infrastructure transparency is therefore relevant for professional trading environments.
Regular software updates ensure compatibility with exchange protocols and evolving cybersecurity standards. Stability is particularly critical for automated systems operating without manual intervention.
Conclusion
The landscape of technical analysis software encompasses a diverse range of tools designed for varying analytical approaches and market participants. TradingView emphasizes advanced chart visualization within a cloud-based framework. MetaTrader and NinjaTrader prioritize automation and algorithmic infrastructure. Thinkorswim integrates derivatives analytics with customization features. TrendSpider automates structural detection, while Bloomberg provides institutional-scale data integration.
Selecting the most suitable platform requires alignment between trading methodology, asset focus, computational needs, and personal workflow preference. Effective technical analysis depends not only on technological capability but also on disciplined strategy development, rigorous backtesting, and structured risk management. Software enhances analytical efficiency and consistency, yet its value is realized only when incorporated within a comprehensive trading framework grounded in measurable performance evaluation.