Risk management remains one of the most decisive factors in long-term trading performance. Among the tools integrated into modern trading platforms, the risk-reward calculator plays a central role in protecting trading capital. While many traders focus primarily on identifying entries and exits, professional participants consistently evaluate the relationship between potential profit and potential loss before entering a trade. Risk-reward calculators formalize this evaluation process and apply mathematical discipline to trading decisions.
Capital markets are inherently uncertain. Price movements are influenced by macroeconomic developments, liquidity conditions, geopolitical events, corporate performance, and trader positioning. Because uncertainty cannot be removed, it must be managed. The primary objective of risk management is not to eliminate losses but to control their magnitude relative to potential gains. A structured framework for measuring risk and reward ensures that exposure is deliberate rather than accidental.
Understanding Risk and Reward in Trading
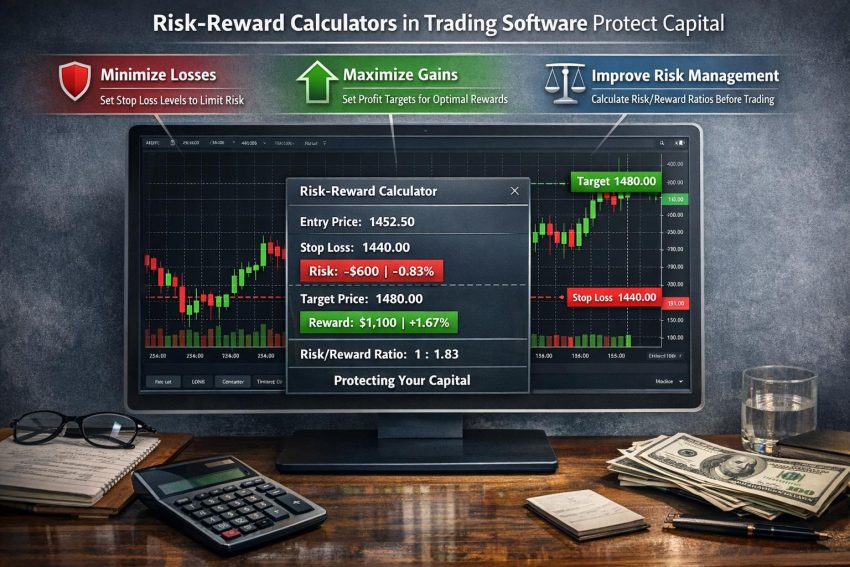
In financial markets, risk represents the potential loss on a trade, while reward represents the potential gain. Both values are defined before a position is opened. Risk is commonly measured as the difference between the entry price and the stop-loss level, multiplied by position size. Reward is defined as the difference between the entry price and the take-profit target, also adjusted for size.
A risk-reward ratio expresses how much potential gain exists relative to potential loss. For example, if a trader risks $100 to potentially earn $300, the ratio is 1:3. This comparison provides clarity because it translates abstract price levels into concrete financial exposure. It forces a trader to evaluate whether the expected gain justifies the possible loss.
Without predefined parameters, traders may adjust stop-loss orders during market fluctuations, increase position size impulsively, or exit profitable positions early. These behaviors distort statistical consistency. The calculator eliminates ambiguity by converting trading scenarios into quantifiable outcomes that can be evaluated objectively.
The Mathematical Foundation of Risk-Reward Analysis
At its core, a risk-reward calculator is an application of probability and expectancy. Trading expectancy measures the average amount a trader can expect to win or lose per trade over a large sample. It is derived from win rate, average gain, and average loss. Even a modest strategy can produce stable returns when risk is structured effectively.
Consider a simplified example. If a strategy risks 1 unit to potentially gain 2 units, and wins 45% of the time, its expectancy may still be positive. The calculator helps project this relationship before trades are executed. Rather than relying on intuition, traders can evaluate how variations in stop distance, target placement, or position size alter expected outcomes.
This mathematical foundation discourages reliance on high win rates alone. A trader winning 70% of trades with a 1:0.5 risk-reward ratio may underperform compared to a trader winning 40% of trades with a 1:3 ratio. The calculator provides a standardized method for comparing such scenarios.
How Risk-Reward Calculators Function
Risk-reward calculators are embedded in most modern trading platforms across asset classes including forex, equities, commodities, futures, and digital assets. Their primary function is to compute monetary exposure based on defined price levels and position size.
The trader inputs four essential variables: entry price, stop-loss level, take-profit level, and trade size. From these, the system calculates projected loss, projected gain, and the resulting ratio. Many platforms also display percentage risk relative to total account equity. This detail is critical because a $500 loss has different implications for a $5,000 account than for a $100,000 account.
Advanced calculators integrate additional variables. Trading fees, spreads, overnight financing costs, leverage, and slippage can be included to produce a more accurate assessment. By presenting real-world cost-adjusted projections, the calculator strengthens capital preservation.
Capital Protection Through Position Sizing
Position sizing is closely linked to risk-reward calculations. Even favorable ratios cannot compensate for oversized trades. The calculator adjusts trade size so that the defined stop-loss corresponds to a specific percentage of account equity.
Professional traders often risk between 1% and 2% of account capital per trade. If the stop-loss must be wide because of volatility, position size is reduced accordingly. If the stop is narrow, size can increase within the same percentage constraint. This dynamic adjustment keeps financial exposure stable.
This method prevents disproportionate drawdowns. A series of losses remains manageable because each trade represents a small fraction of total capital. The mathematical advantage lies in preservation. Large losses require progressively larger gains to recover. Limiting downside exposure protects long-term compounding potential.
The Relationship Between Risk-Reward Ratio and Win Rate
Risk-reward ratios directly influence the minimum win rate required for profitability. This relationship is often misunderstood. Traders may attempt to increase win frequency without assessing whether average losses exceed gains.
For a 1:1 ratio, the break-even win rate is slightly above 50% when transaction costs are considered. For a 1:2 ratio, the required win rate declines to around 34%. With a 1:3 ratio, it falls further. Calculators frequently display this break-even threshold, enabling traders to assess strategy feasibility before execution.
This perspective shifts focus from predicting outcomes to structuring exposure. By aligning stop-loss and take-profit levels with statistical probabilities, traders build resilience into their methodology.
Reducing Emotional Decision-Making
Emotional responses can distort trading performance. Fear may cause early exits from profitable trades, reducing average reward. Overconfidence may result in widening stop-loss levels beyond planned limits. Both actions erode consistency.
A predefined risk-reward structure introduces rule-based decision-making. Once parameters are set, execution becomes procedural. The calculator’s clarity reduces temptation to alter trade conditions mid-position. When outcomes are evaluated through consistent risk metrics, performance analysis becomes more objective.
Discipline in applying predefined ratios contributes to measurable data. Over time, traders can compare expected performance with actual outcomes and refine strategies based on evidence rather than perception.
Supporting Strategy Evaluation and Backtesting
Backtesting environments rely heavily on risk-reward inputs. When simulating historical trades, applying consistent risk percentages allows accurate analysis of drawdowns, return volatility, and profit factor. Without standardized exposure levels, backtest results become distorted.
Through repeated historical application, traders can observe the stability of equity curves and determine whether a strategy tolerates adverse market cycles. Calculators provide a standardized reference point that ensures each simulated trade reflects realistic capital allocation.
This structured testing environment filters out strategies that lack sufficient reward relative to risk before live capital is deployed.
Managing Leverage Responsibly
Leverage increases exposure without requiring equivalent capital outlay. While it can amplify gains, it also magnifies losses. Uncontrolled leverage is one of the primary causes of rapid account depletion.
Risk-reward calculators translate leveraged positions into actual monetary risk. A highly leveraged trade with a tight stop may appear modest in pip distance but substantial in dollar terms. By revealing true exposure, the calculator encourages alignment with predefined percentage limits.
Responsible leverage usage is therefore integrated into the broader risk framework rather than treated as a separate consideration.
Adapting to Market Volatility
Volatility varies across instruments and market conditions. Economic releases, earnings announcements, or geopolitical developments can temporarily increase price fluctuations. Wider price swings require adjusted stop-loss placement.
When stops are widened to reflect volatility, position size must shrink to maintain consistent percentage risk. Calculators automate this adjustment. The result is standardized exposure across changing environments. A trader maintaining 1% risk per trade preserves uniform risk regardless of stop distance.
This adaptability is especially important for multi-asset traders who operate in instruments with differing volatility profiles.
Preventing Overtrading and Capital Erosion
Overtrading often stems from insufficient qualification criteria. When risk-reward ratios are calculated systematically, trades failing to meet minimum standards become visible immediately. If a potential setup offers limited upside relative to required stop distance, its unfavorable structure is quantified.
By applying minimum ratio rules, traders reduce exposure to marginal setups. This filtering process narrows activity to scenarios supported by acceptable mathematical conditions, thereby reducing cumulative transaction costs and unnecessary drawdowns.
Facilitating Portfolio-Level Risk Control
Individual trade management is one component of capital protection. Portfolio-level oversight considers total exposure across correlated positions. A trader might individually risk 1% on several trades, yet collective exposure could exceed intended limits if instruments move together.
Integrated calculators aggregate open risk and display total potential loss if all stops are triggered. This aggregate perspective prevents concentration risk. It ensures that diversification is genuine rather than superficial.
Portfolio awareness strengthens resilience during periods of systemic market stress when correlations increase.
The Role of Compounding in Capital Preservation
Controlled compounding is a direct outcome of structured risk percentages. As account equity grows, position sizes increase proportionally while maintaining the same risk fraction. Growth becomes geometric yet regulated.
Conversely, during drawdowns, position sizes contract. This automatic scaling moderates volatility in the equity curve. Over time, this stabilizing effect can significantly improve survivability during unfavorable conditions.
The calculator serves as the mechanism that recalibrates exposure after each capital fluctuation.
Integration with Automated Trading Systems
Algorithmic trading systems embed predefined risk-reward rules into execution logic. Before an order is transmitted, the algorithm verifies compliance with risk parameters. If projected exposure exceeds limits, the trade is modified or rejected.
This systematic gatekeeping removes discretionary inconsistencies. By standardizing exposure across hundreds or thousands of trades, automated systems rely on risk-reward discipline as a foundational safeguard.
Limitations and Proper Use
Risk-reward calculators do not predict price direction. They serve as measurement tools, not forecasting models. A trade structured with a favorable ratio can still result in loss if market conditions change or analysis is flawed.
Unrealistic take-profit levels may create deceptively attractive ratios but reduce the probability of execution. Effective application requires aligning reward targets with observable market structure, liquidity, and historical volatility. Balanced implementation ensures ratios reflect attainable outcomes rather than theoretical extremes.
Consistency and Long-Term Capital Stability
Long-term success depends more on consistent application of risk principles than on individual trade results. By applying defined ratios across extensive trade samples, traders allow statistical expectancy to operate. Variability in short-term outcomes diminishes in relevance when exposure remains uniform.
Risk-reward calculators contribute to this uniformity. They transform subjective judgment into defined parameters, stabilizing performance metrics over time. Losses remain contained, and gains accumulate within structured boundaries.
In competitive financial markets, capital preservation precedes expansion. Sustained participation requires protection against severe drawdowns. By formalizing the relationship between potential loss and potential gain, risk-reward calculators create a measurable and repeatable framework for disciplined capital management.