Financial markets generate vast quantities of price and volume data across asset classes including equities, foreign exchange, commodities, derivatives, and digital assets. Each transaction contributes to a continuously evolving record of supply and demand. For traders and market analysts, the central challenge is not access to information but interpretation. Charting software plays a critical role in this interpretative process by converting raw numerical inputs into structured visual frameworks. These frameworks make it possible to observe subtle market transitions, identify developing momentum, and respond to changes in direction before they become broadly recognized.
As electronic trading infrastructure has advanced, the importance of timely data analysis has increased. Market participants operate within compressed time horizons, and price adjustments can occur within minutes or seconds. In this environment, early recognition of emerging trends depends on tools capable of organizing information dynamically. Charting platforms fulfill this function by integrating price feeds, overlaying analytical indicators, and enabling multi-dimensional comparisons across timeframes and instruments.
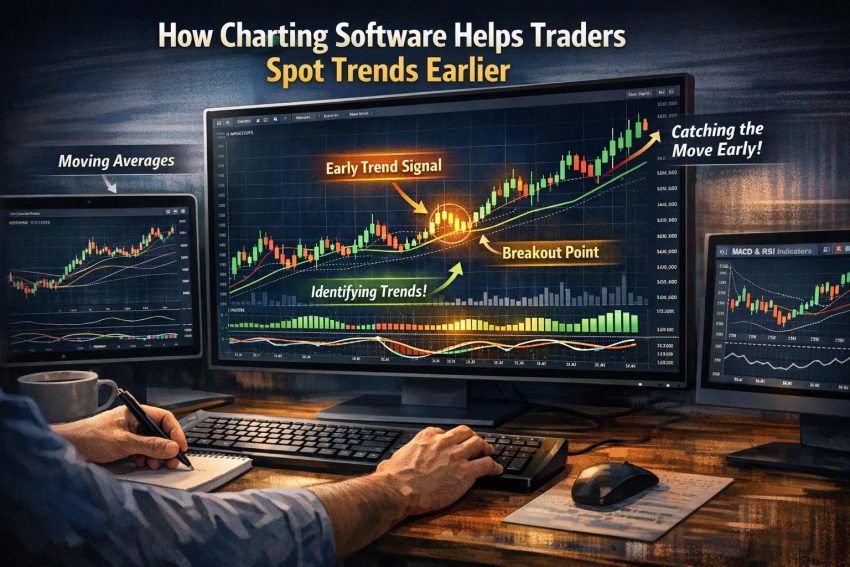
The Role of Visualization in Market Analysis
Price data in its raw form typically appears as a sequence of numbers reflecting transaction values at specific timestamps. While accurate, numerical tables do not easily communicate direction or momentum. Visualization solves this limitation by inserting structure into time-series data. Through candlestick charts, bar charts, area charts, and line graphs, market movements become observable patterns rather than disconnected figures.
Candlestick charts, in particular, illustrate four essential data points within a single interval: opening price, closing price, highest traded value, and lowest traded value. By consolidating these metrics into a single graphical unit, traders gain immediate insight into volatility and directional bias. Expanding candlestick bodies may indicate growing conviction among participants, whereas narrow bodies may reflect indecision. Over time, sequences of such formations reveal directional tendencies that would remain obscured in spreadsheet format.
Visualization also allows traders to understand proportional change. A steady slope upward on a weekly chart communicates sustained demand, while erratic fluctuations around a horizontal axis reflect range-bound conditions. Recognizing these distinctions early enables traders to shift strategies accordingly, such as favoring trend-following approaches during directional markets or mean-reversion methods during consolidation.
Interpreting Market Structure and Trend Formation
At its core, a trend is defined by recurring structural behavior. An uptrend is characterized by progressively higher highs and higher lows, while a downtrend forms through lower highs and lower lows. Charting software simplifies identification of these formations by aligning price sequences along a time axis and preserving historical context.
Structural clarity assists traders in detecting the early stages of reversal. For example, if a prolonged downtrend begins to produce higher lows, this deviation from established behavior may signal diminishing selling pressure. When such shifts appear across multiple consecutive intervals, traders interpret them as early structural changes rather than isolated anomalies. Visual continuity makes these deviations more apparent and reduces ambiguity.
Range contraction is another structural clue preceding directional expansion. When price oscillates within narrowing boundaries, it often reflects equilibrium between buyers and sellers. Charting platforms make narrowing price channels visually evident. Traders who monitor these developments can anticipate an eventual breakout, positioning themselves before the market reestablishes directional momentum.
Real-Time Data Integration and Immediate Feedback
Modern trading environments demand continuous monitoring of market movement. Charting software connects directly to exchange feeds and broker liquidity providers to deliver real-time data integration. Rather than relying on delayed summaries, traders observe changes as they unfold.
Immediate feedback is essential for early trend recognition. Suppose a security begins to rise with accelerating speed and expanding volume. Real-time candlestick expansion may indicate increasing institutional participation. Without contemporary updates, this shift might only be visible after the majority of the move has occurred. Timely visualization allows traders to evaluate whether initial price acceleration represents temporary volatility or the beginning of sustained momentum.
Real-time integration also supports intraday analysis. Shorter interval charts, such as five-minute or one-minute frames, provide granular detail about micro-trends. When short-term momentum aligns with emerging patterns on higher intervals, traders gain layered confirmation. This synchronization often marks the early establishment of broader trends.
Multiple Timeframe Analysis as Contextual Alignment
Trend development rarely occurs uniformly across all time horizons. A currency pair may remain in a long-term uptrend while experiencing short-term corrective pullbacks. Charting software enables immediate switching between timeframes, preserving indicators and annotations across views. This feature provides contextual alignment.
Multiple timeframe analysis assists traders in identifying inflection points. A daily chart might show price nearing a critical resistance level established months earlier. Meanwhile, a one-hour chart may reveal rising short-term demand pushing toward that barrier. Recognizing the convergence between near-term pressure and long-term resistance allows traders to prepare for an early breakout or rejection scenario.
Without automated timeframe aggregation, assembling these perspectives would require manual data compilation. Charting software maintains synchronized datasets, enabling rapid reassessment of directional bias. When short, medium, and long-term charts begin to reflect similar movement patterns, the probability of meaningful trend initiation increases. Early detection relies not on a single timeframe but on corroboration across intervals.
Technical Indicators as Quantitative Filters
In addition to raw price visualization, charting platforms incorporate technical indicators that convert historical price relationships into mathematical expressions. Indicators function as analytical filters that reduce noise and highlight underlying strength or weakness.
Moving averages remain among the most widely used tools. By calculating the average closing price over a defined period, they smooth fluctuations and make direction clearer. When price consistently trades above a rising moving average, upward momentum may be developing. Crossovers between shorter-term and longer-term averages often provide early signals of directional change.
The Relative Strength Index (RSI) measures the speed of price movements, indicating whether an asset is approaching statistically extreme conditions. Divergences between price and RSI frequently precede visible price reversals. For instance, if price establishes a new high while RSI fails to confirm that high, momentum may be weakening. Charting software displays such divergences graphically, enabling earlier interpretation.
The Moving Average Convergence Divergence (MACD) indicator compares multiple moving averages to detect shifts in trend strength. Histogram expansions or contraction near the zero line can signal emerging directional bias before substantial price movement becomes evident.
When used responsibly, these indicators complement price action rather than replacing it. Their primary benefit lies in providing systematic confirmation that reduces uncertainty during early stages of trend formation.
Volume as a Measure of Participation
Price direction alone does not reveal the level of institutional or retail commitment behind a movement. Volume analysis addresses this gap by measuring the number of units traded during each interval. Charting software integrates volume bars directly beneath price charts for side-by-side interpretation.
An early-stage uptrend accompanied by expanding volume often reflects genuine demand expansion. Growing participation suggests that larger market actors may be accumulating positions. Conversely, price increases on declining volume may represent temporary short covering rather than durable buying pressure.
Volume spikes during breakout attempts provide additional confirmation. If price breaches a defined resistance level while trading activity accelerates significantly above average, traders interpret the event as stronger evidence of sustained direction. Visual juxtaposition of price breakout and volume expansion enhances clarity at critical junctures.
Pattern Recognition and Automated Scanning
Technical analysis frequently relies on recurring formations such as triangles, rectangles, channels, and head-and-shoulders structures. Identifying these shapes manually across numerous instruments can be time-consuming. Advanced charting platforms include automated pattern recognition engines that scan for predefined configurations.
When a formation nears completion, the software highlights relevant boundaries and potential breakout points. This automation does not replace analytical judgment but accelerates detection. Early identification of contracting volatility patterns allows traders to monitor confined price ranges before expansion occurs.
Algorithmic scanning extends this capacity across multiple markets simultaneously. Traders monitoring dozens of equities or currency pairs can define criteria such as moving average alignment, RSI thresholds, or volatility compression. The software filters assets meeting those criteria, drawing attention to markets where a trend may soon materialize. This systematic filtering enhances efficiency and reduces oversight risk.
Customizable Alerts and Conditional Triggers
Continuous monitoring of numerous charts is impractical. Charting software addresses this limitation through programmable alerts. Traders can establish notifications tied to price thresholds, indicator crossovers, or volatility metrics. Alerts serve as conditional triggers that activate when predefined criteria are satisfied.
For example, if price approaches a multi-month resistance area, a trader can configure an alert slightly beyond that level. When price surpasses it, the system notifies the trader, signaling a potential continuation phase. Immediate awareness allows timely evaluation before the move becomes extended.
Alert systems promote disciplined attention management. Rather than reacting impulsively to random price fluctuations, traders focus on pre-established scenarios. This structured approach improves early response without encouraging unnecessary activity.
Backtesting and Historical Scenario Analysis
Reliable early trend detection depends on understanding how similar scenarios unfolded in the past. Charting software provides access to extensive historical datasets, allowing traders to evaluate precedent conditions. By studying past breakouts, retracements, and consolidation phases, traders refine their criteria for identifying comparable developments.
Backtesting features enable simulation of trading strategies under historical market conditions. A trader may test whether a combination of moving average crossover and rising volume historically preceded significant price advances. Statistical outcomes from these simulations inform expectations and risk management parameters.
Historical examination reduces speculation by grounding decisions in empirical observation. While no pattern guarantees repetition, statistical consistency strengthens analytical confidence and improves early-stage assessment.
Drawing Tools and Structural Mapping
Beyond automated indicators, charting platforms include manual drawing utilities that assist in structural mapping. Trendlines connect sequential highs or lows, visually defining directional channels. Horizontal lines mark support and resistance levels, representing zones where supply-demand balance previously shifted.
Fibonacci retracement tools estimate potential corrective zones within emerging trends. When price pulls back toward these mathematically derived levels and resumes direction with increasing volume, traders may interpret the behavior as confirmation of sustained trend strength.
Manually annotating charts fosters engagement with structural relationships. Early deviations from established trendlines often mark turning points. If price breaks above a descending channel boundary after prolonged decline, the breach can represent diminishing downside momentum. Charting software ensures that annotations adjust dynamically as new data emerges, preserving continuity.
Integration with Broader Trading Infrastructure
Modern platforms frequently integrate charting capabilities directly with brokerage execution systems. This integration shortens the interval between analysis and transaction placement. When a trader observes early signs of breakout momentum, orders can be executed without shifting interfaces.
Additionally, many platforms display macroeconomic calendars, earnings schedules, and volatility metrics within the same workspace. Coordinated visibility of technical and fundamental factors improves situational awareness. If technical indicators signal upward pressure shortly before a positive earnings announcement, contextual alignment may reinforce interpretative confidence.
Such integration reduces latency between detection and action. In competitive markets, delays can erode advantage. Combining analytical and execution tools enhances responsiveness during early trend formation.
Algorithmic and AI-Enhanced Analytical Features
Some charting solutions incorporate algorithmic intelligence designed to evaluate statistical relationships beyond manual observation. Machine learning systems can detect correlations, volatility clustering, or non-linear momentum signatures that precede trend expansion. By comparing current conditions with extensive historical libraries, AI modules may highlight analog scenarios.
These capabilities broaden analytical scope, especially for institutional participants monitoring diversified portfolios. Automated systems continuously scan multiple markets for early-stage alignment with predefined characteristics. Traders then conduct independent validation before implementing strategies.
While artificial intelligence enhances efficiency, responsible utilization requires understanding methodological constraints. Algorithms rely on historical data and may underperform during unprecedented regimes. Nevertheless, when combined with traditional chart analysis, AI tools can improve anticipatory capacity.
Psychological Stability Through Structured Analysis
Effective trend identification requires clarity of thought. Market volatility can introduce uncertainty, leading to hesitation or premature reaction. Structured visual analysis provides a stabilizing framework. By relying on objectively defined signals, such as confirmed trendline breaks or validated indicator crossovers, traders reduce subjective interpretation.
Charting software standardizes evaluation through templates and preset configurations. When traders apply consistent analytical criteria, they are better positioned to differentiate between random fluctuation and meaningful directional change. This procedural consistency supports earlier yet controlled response to emerging momentum.
Limitations and Balanced Application
Despite its analytical advantages, charting software does not eliminate risk or forecast outcomes with certainty. False signals, particularly during low-liquidity environments, can mislead interpretation. Unexpected geopolitical or economic events may invalidate technical structures instantly.
Overreliance on numerous indicators can produce conflicting signals and analytical paralysis. Excessive visual overlays diminish clarity. A focused framework emphasizing a limited set of complementary tools typically yields better interpretative precision. Risk management practices, including position sizing and protective stop placement, remain integral regardless of chart signals.
Understanding the underlying logic of each analytical tool is essential. Indicators are mathematical transformations of price; they do not operate independently of market behavior. Informed application enhances insight, whereas mechanical usage without comprehension may produce inconsistent results.
Conclusion
Charting software has become foundational in contemporary trading ecosystems because it transforms continuous streams of market data into actionable visual intelligence. Through structured chart formats, real-time feed integration, multiple timeframe alignment, and quantitative indicators, these platforms enable traders to discern subtle transitions at early stages of trend development.
Supplementary capabilities such as volume correlation, automated pattern recognition, alert configuration, historical backtesting, and algorithmic scanning further refine analytical depth. Integration with brokerage and informational infrastructure shortens the path from observation to execution. Although no analytical system can guarantee predictive accuracy, the systematic organization and visualization of data significantly enhance responsiveness to evolving conditions.
In increasingly data-intensive markets, the capacity to interpret information quickly and coherently is critical. Charting software supports this objective by providing structured, adaptable frameworks through which emerging trends can be identified with greater precision and timeliness.