
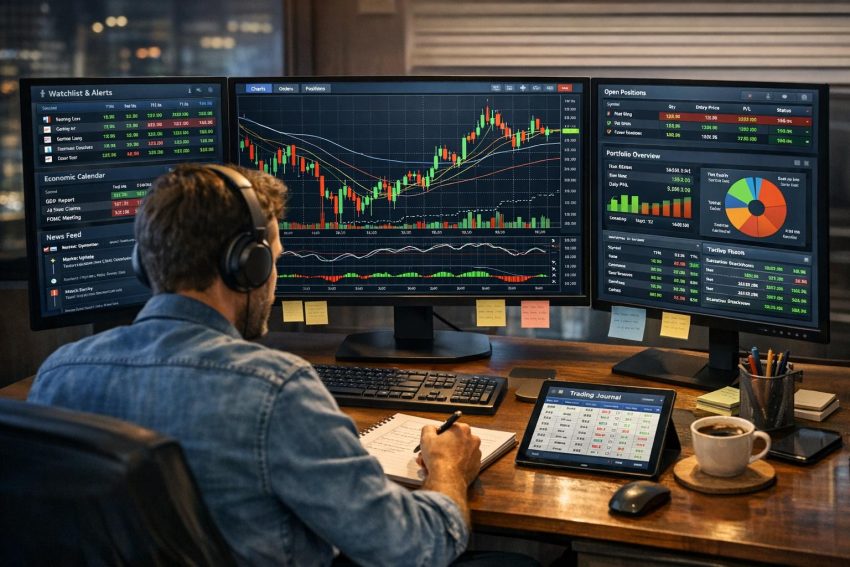
Trading in financial markets involves processing large volumes of information in real time. Prices fluctuate continuously, news events influence sentiment, and multiple positions may be open simultaneously across asset classes. In this environment, staying organized is essential. Trading dashboards serve as centralized interfaces where traders can monitor market data, track performance, manage risk, and execute trades efficiently. By consolidating critical information into a structured layout, dashboards help traders maintain clarity, reduce operational errors, and support consistent decision‑making.
Unlike fragmented workflows that require several independent platforms, a dashboard integrates essential components into a unified workspace. This integration does not merely save time; it reshapes how traders interpret information. With structured visualization and synchronized data streams, traders gain the ability to view markets, risk metrics, and account information as interconnected elements rather than isolated fragments.
The Core Purpose of a Trading Dashboard
A trading dashboard functions as a control center for market participation. Instead of switching between separate applications for charting, order management, economic calendars, and account analytics, traders operate from a single structured interface. The reduction in platform switching streamlines workflow and lowers the probability of mistakes caused by distraction or delayed access to information.
The primary purpose of a dashboard is to deliver real-time visibility. Live price feeds, bid‑ask spreads, order book depth, margin requirements, and open positions are updated continuously. This constant flow of synchronized information enables traders to evaluate whether market conditions align with strategic criteria.
Beyond visibility, dashboards provide context. Market prices on their own provide limited insight. When price movements appear alongside volume data, volatility indicators, or macroeconomic events, they form a cohesive analytical picture. A well‑structured dashboard arranges these elements logically so traders can observe relationships between variables rather than reviewing them independently.
In addition, dashboards frequently incorporate execution functionality. Orders can be placed, modified, or closed directly within the same interface used for analysis. This linkage between insight and action supports operational efficiency while maintaining situational awareness.
Centralized Market Monitoring
Financial markets operate across time zones and asset classes. Equities, futures, options, currencies, and digital assets may all move simultaneously. For traders engaged in multi‑asset strategies, observing several instruments individually can fragment attention.
Centralized monitoring addresses this challenge. Dashboards allow multiple charts, watchlists, and analytical tools to appear within one workspace. Traders can dedicate specific areas of the screen to particular markets, time frames, or strategies. For instance, a macro‑oriented trader may position currency pairs near sovereign bond yields and commodity benchmarks to monitor cross‑asset interaction.
Centralization enhances situational awareness. When correlated assets are displayed in proximity, relationships become easier to identify. A movement in crude oil prices might coincide with shifts in certain currency pairs; changes in interest rate futures could influence equity indices. Viewing these instruments simultaneously supports timely interpretation of interconnected behavior.
Watchlist functionality is another aspect of centralized monitoring. Traders can categorize instruments by sector, volatility profile, or strategic relevance. Real‑time performance indicators within these lists provide quick reference points. Instead of scanning numerous charts to detect activity, traders can rely on consolidated views that highlight percentage changes, volume spikes, or unusual activity.
Over time, centralized monitoring establishes procedural consistency. When markets are observed through a stable layout, traders become familiar with the placement of key data points. This familiarity reduces friction and supports concentration during active trading sessions.
Portfolio and Position Tracking
Organizational clarity extends beyond market observation to the management of active trades. A trading dashboard typically includes a detailed portfolio overview. Open positions are displayed with entry price, current price, position size, unrealized profit or loss, margin allocation, and associated stop‑loss or take‑profit levels.
Continuous updates provide an accurate representation of exposure. Without this centralized overview, traders may lose track of cumulative risk across multiple instruments. For example, holding positions in correlated equities may increase directional exposure beyond initial expectations. A dashboard that aggregates these exposures provides a clearer understanding of overall portfolio balance.
Real‑time performance tracking contributes to disciplined capital management. Metrics such as daily returns, cumulative performance, average gain relative to average loss, and risk‑adjusted ratios can be displayed alongside active trades. Rather than separating execution from evaluation, dashboards integrate both processes into one environment.
This integration promotes informed adjustments. When performance metrics reveal underperformance within a particular asset class or strategy, traders can respond with measured recalibration rather than reactive decision‑making. Portfolio tracking therefore becomes both analytical and operational, shaping current trade management while informing strategic shifts.
Historical trade logs embedded in dashboards also support organizational continuity. Each transaction is recorded with timestamps, order types, and execution prices. Structured record‑keeping simplifies auditing and enables methodical review.
Risk Management Integration
Risk management is fundamental to long‑term participation in financial markets. Trading dashboards embed risk controls directly into their interface, making exposure transparent at all times. When placing orders, traders can define position size relative to account balance, set protective stop levels, and establish profit objectives within the same workflow.
Visible margin utilization and equity fluctuations reduce the likelihood of overextension. A dashboard that displays account leverage and free capital in real time enables traders to assess whether new trades align with predetermined risk thresholds.
Advanced dashboards incorporate risk metrics such as value at risk, portfolio beta, or sector concentration. These indicators present exposure in quantitative terms, reducing reliance on estimation. When risk metrics are integrated into the main view rather than hidden in secondary reports, they remain part of everyday decision‑making.
Alerts are often embedded as well. Notifications triggered by drawdown limits or volatility spikes prompt structured reassessment. Instead of discovering risk imbalances after significant losses, traders receive early signals that encourage disciplined review.
Risk integration also supports scenario analysis. Some dashboards provide tools for stress testing positions against simulated market movements. This capability allows traders to visualize potential portfolio changes under adverse conditions without executing live trades. Such integrated simulations contribute to more comprehensive planning.
Customization and Workflow Efficiency
No two traders operate identically. Some rely heavily on short‑term price action, while others analyze macroeconomic cycles or algorithmic signals. Trading dashboards accommodate this diversity by offering customization options that align with individual workflows.
Users can adjust the layout, reposition charts, define default order sizes, and select preferred indicators. By configuring the interface to reflect personal methodology, traders minimize unnecessary elements and emphasize relevant data. The resulting structure supports concentration and procedural consistency.
Workflow efficiency is also enhanced through direct integration of technical tools. Indicators, drawing instruments, and annotation features are embedded within charts. Traders can evaluate setups and execute trades without shifting applications. This continuity reduces the time between analysis and action.
Keyboard shortcuts and predefined templates further streamline execution. For high‑frequency participants or day traders, seconds can influence entry prices. A dashboard that allows rapid order placement while preserving oversight of account metrics supports timely responses.
Mobile synchronization enhances workflow consistency. Cloud‑based dashboards ensure that configuration settings and watchlists remain identical across devices. Traders who transition between desktop terminals and mobile platforms encounter the same organizational structure, reducing the chance of oversight.
Data Visualization and Analytical Clarity
Raw financial data can be difficult to interpret in numerical form alone. Dashboards convert numerical streams into visual formats such as candlestick charts, line graphs, heat maps, and comparative performance tables. This transformation enhances interpretability and supports faster pattern recognition.
Technical indicators displayed alongside price data help identify trends, momentum shifts, and volatility expansions. When these elements are arranged coherently, traders can evaluate multiple signals without crowding the workspace. Balanced visualization reduces informational overload.
Heat maps illustrating sector or asset performance provide macro‑level context. For example, a trader can quickly observe whether gains are concentrated in a particular industry or distributed broadly across markets. This perspective supports decisions about diversification and sector exposure.
Visual performance analytics also play a role in self‑assessment. Equity curves illustrate account growth over time, while drawdown charts display periods of decline. When these visuals are integrated into the main interface, traders gain an ongoing awareness of long‑term trajectory rather than focusing exclusively on short‑term fluctuations.
Correlation matrices can further enhance analytical clarity. By showing statistical relationships among instruments, dashboards assist traders in identifying redundant exposures. Recognizing high correlation between trades may prompt position adjustments to maintain diversification.
Overall, structured visualization transforms complex datasets into organized frameworks that facilitate rational evaluation.
Integration with External Information Sources
Market prices reflect not only technical factors but also news events, corporate disclosures, and macroeconomic releases. Trading dashboards frequently incorporate external information streams alongside price data.
Economic calendars embedded within the interface list upcoming reports such as employment data, interest rate decisions, or corporate earnings announcements. When traders view these events in context with open positions, they can anticipate potential volatility. Preparation may include adjusting stop levels, reducing exposure, or avoiding new entries before high‑impact announcements.
Financial headlines displayed next to relevant instruments provide immediate contextual awareness. Instead of searching separate websites for updates, traders receive summarized information within their primary workspace. This integration reduces fragmentation of attention.
Some dashboards introduce sentiment indicators derived from market positioning data or analyst consensus. While such metrics are interpretive rather than definitive, having them accessible within a structured layout contributes to comprehensive market evaluation.
The unification of external and internal data streams ensures that analytical review remains holistic rather than compartmentalized.
Automation and Algorithmic Support
Algorithmic trading systems increasingly coexist with discretionary strategies. Dashboards serve as supervisory tools for automated processes. Even when algorithms execute trades, human oversight is required to evaluate performance and detect irregularities.
Within a dashboard, algorithmic metrics such as trade frequency, execution slippage, and cumulative return can be monitored in real time. Execution logs document each automated action, preserving transparency and traceability.
Backtesting modules integrated into dashboards allow traders to evaluate strategies against historical data. By simulating performance under past market conditions, users can refine parameters before live deployment. When research tools are part of the same environment as live execution, continuity between testing and application improves.
Dashboards may also enable hybrid workflows. Traders can combine automatic entry triggers with manual confirmation, blending systematic structure with discretionary judgment. The interface becomes a framework for oversight rather than merely a display of prices.
Collaboration and Institutional Application
In institutional environments, organization extends beyond individual workflows. Multiple stakeholders—including portfolio managers, risk officers, and compliance teams—require coordinated access to information. Shared trading dashboards synchronize data across departments.
Permission‑based access controls determine which users can execute trades, adjust exposure, or view specific reports. Audit trails record activity, preserving accountability. These structured systems facilitate compliance with regulatory standards while maintaining operational clarity.
Collaborative annotation tools allow teams to document observations directly on charts or performance reports. Shared insights reduce miscommunication and create a centralized record of strategic reasoning. During periods of heightened market volatility, synchronized dashboards ensure that all decision‑makers operate from consistent information.
By centralizing oversight, institutional dashboards contribute to governance and transparency as well as trading efficiency.
Performance Review and Strategic Refinement
Organization includes structured reflection on past performance. Dashboards commonly provide analytical modules for reviewing historical trades. Filters can sort performance by instrument, time period, strategy classification, or market condition.
Metrics such as average holding duration, risk‑reward ratios, and percentage of profitable trades offer insight into systematic tendencies. When these statistics are visually presented, recurring patterns become more apparent. Traders can assess whether particular strategies demonstrate consistency or require adjustment.
Integrated reporting tools support periodic evaluation without exporting data to separate analytics software. By conducting performance analysis within the same environment used for execution, traders maintain continuity and reduce the risk of incomplete records.
Structured review processes contribute to incremental improvement. Instead of relying on memory or anecdotal evidence, traders base refinements on documented data. The dashboard thus evolves into both a real‑time instrument and a historical archive.
Security, Stability, and Data Integrity
Operational security is an essential part of organized trading. Dashboards incorporate authentication protocols, encryption standards, and secure data routing to protect account information. Reliable infrastructure ensures that data integrity is preserved during high‑volume market activity.
Role‑based access and transaction verification tools reduce unauthorized activity. For institutional users, structured permission hierarchies help separate trading authority from supervisory roles. These controls maintain procedural discipline and operational stability.
Data backup and synchronization mechanisms further reinforce reliability. Cloud‑based storage ensures that performance records and configuration settings remain accessible even if local systems fail. Stability in software design contributes to consistent user experience and reduces disruptions during active sessions.
Adaptation Across Devices and Environments
Modern traders often operate across multiple locations and devices. A cohesive dashboard system synchronizes layouts, watchlists, and preferences across desktops, tablets, and smartphones. This consistency preserves organizational structure regardless of hardware.
Responsive design ensures that essential metrics remain readable on smaller screens without sacrificing clarity. While advanced charting may be more suitable for larger displays, core functions such as monitoring open positions and adjusting risk parameters remain accessible remotely.
The ability to maintain oversight while away from primary workstations enhances operational continuity. Traders can respond to market developments without reconstructing their analytical setup. Consistent design principles across environments reinforce habitual workflows and reduce confusion.
Conclusion
Trading dashboards are central to maintaining organization in dynamic financial markets. By consolidating price data, portfolio metrics, risk parameters, and analytical tools within a unified interface, they reduce fragmentation and enhance clarity. Centralized monitoring supports awareness of intermarket relationships, while integrated performance tracking links execution with evaluation.
Embedded risk management tools encourage disciplined exposure control. Customization features align the environment with individual workflows, and visual analytics transform complex information into structured insight. Integration with external data, algorithmic oversight, and institutional collaboration further expand the role of dashboards beyond basic chart display.
Across individual and professional contexts, dashboards function as comprehensive control centers. Their structured design supports systematic decision‑making, operational efficiency, and consistent risk oversight. In markets defined by continuous information flow, the ability to organize data effectively remains an essential component of sustainable trading.