Support and resistance levels are core concepts in technical analysis. They represent price areas where buying or selling pressure has historically been strong enough to halt or reverse a trend. Modern trading software has transformed how traders identify, monitor, and interpret these levels. Instead of relying solely on manual chart inspection, traders now use automated tools, customizable indicators, and real-time alerts to track price behavior across multiple markets. Understanding how to use trading software effectively for this purpose can improve analytical consistency, risk control, and trade execution.
Understanding Support and Resistance in Market Structure
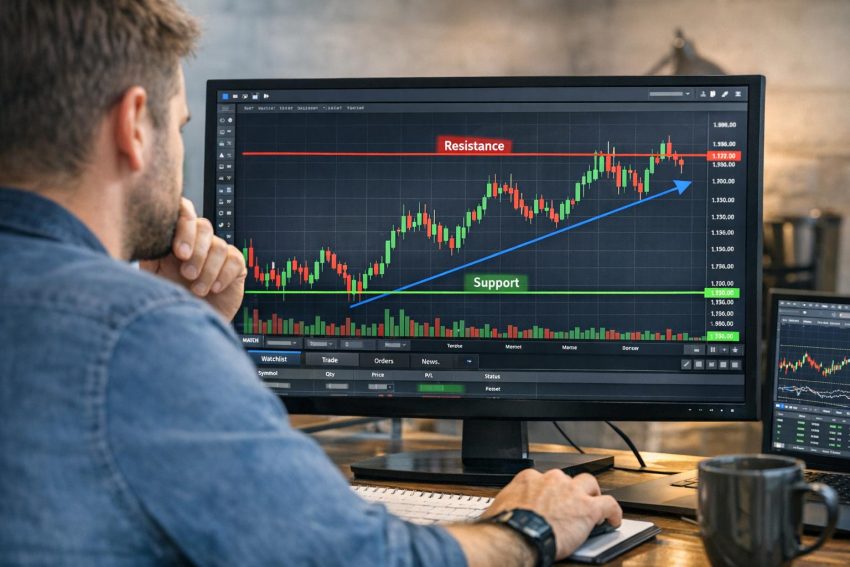
Support is a price level where demand historically outweighs supply, causing a declining market to pause or reverse. Resistance is the opposite: a level where selling pressure overcomes buying interest, often halting upward movement. These levels should not be treated as precise numerical points; they typically function as zones that reflect liquidity concentrations and shifts in market sentiment.
Price movement in financial markets is influenced by positioning from institutions, algorithmic trading systems, and retail traders. When a specific area has previously generated a strong reaction, many participants remember that location and adjust their orders accordingly. Trading software visualizes these repeated reactions, making it easier to see clusters of price interaction around particular levels.
Support and resistance are closely connected to overall market structure. In an uptrend characterized by higher highs and higher lows, former resistance levels often become new support after being broken. In a downtrend, prior support frequently transforms into resistance. Charting platforms allow traders to observe these transitions clearly, especially when historical data is scrollable and zoomable across extended time horizons.
Static and Dynamic Levels
Support and resistance can be categorized as static or dynamic. Static levels are horizontal zones derived from historical highs and lows. They remain fixed until price meaningfully invalidates them. Dynamic levels change over time and are often represented by trendlines or moving averages. Trading software enables traders to track both forms simultaneously.
Horizontal levels are commonly associated with consolidation ranges. When price repeatedly trades between a defined upper and lower boundary, these edges form resistance and support zones. Breakouts beyond such ranges often generate increased volatility, and trading software can highlight these boundaries using rectangular drawing tools or automated range-detection indicators.
Dynamic levels require ongoing observation. Moving averages, for example, adapt as new data is incorporated. Many traders treat longer-period moving averages as dynamic support or resistance in trending markets. Platforms allow these averages to be customized by period, calculation method, and visual style, facilitating comparative analysis across assets.
Charting Platforms and Their Role
Most modern trading platforms integrate comprehensive charting environments. Whether broker-provided or third-party, these platforms include drawing tools, indicator libraries, and flexible timeframe selection. Their primary advantage lies in visual clarity and data accessibility.
Manual drawing tools form the basis of most support and resistance analysis. Traders mark horizontal lines at zones of repeated interaction, creating a visual map of price memory. More advanced environments allow annotations, color-coding, and layered objects so that different categories of levels can be distinguished without ambiguity.
Templates help maintain analytical consistency. A trader can save preferred chart settings, including color themes, candlestick styles, indicator parameters, and drawing formats. This reduces variation between sessions and supports objective decision-making.
Manual Identification Using Drawing Tools
Even with automated features available, manual marking remains central to many strategies. Horizontal lines, trendlines, channels, and shaded rectangles are frequently used to define market reaction zones.
When identifying support, traders often look for areas where price has bounced multiple times. The more frequently a level is respected without significant violation, the more technically relevant it may become. Trading software assists by enabling precise placement of lines at candle bodies or wicks, depending on analytical preference.
Volume indicators positioned beneath price charts offer further insight. If strong buying volume accompanied a previous rally from support, that level may carry greater structural importance. Conversely, weak volume around a resistance break may indicate vulnerability. The integration of volume within charting software allows visual confirmation without switching between platforms.
Trendlines represent a different dimension of analysis. By connecting rising swing lows in an uptrend or falling swing highs in a downtrend, traders establish sloping support or resistance boundaries. Platforms permit adjustment as new candles form, keeping dynamic levels aligned with evolving structure.
Automated Support and Resistance Indicators
Many platforms include automated tools designed to reduce subjectivity. These indicators apply predefined mathematical rules to calculate potential reversal areas.
Pivot points are particularly common in intraday trading. Derived from the prior session’s high, low, and close, they generate a central pivot along with multiple support and resistance projections. Day traders appreciate pivots because they are standardized; every participant using the same formula sees identical levels.
Fibonacci retracement tools allow traders to select a swing high and low and automatically plot retracement ratios such as 38.2%, 50%, and 61.8%. These ratios are widely observed in global markets and can coincide with psychological pricing thresholds.
Some advanced platforms apply clustering algorithms to identify areas where price has consolidated extensively. These zones may represent substantial agreement between buyers and sellers. While automation reduces bias, users should understand how each indicator calculates its outputs to prevent overreliance.
Multi-Timeframe Analysis
Support and resistance gain broader relevance when visible across multiple timeframes. A level identified on a weekly chart frequently carries more structural weight than one formed on a five-minute chart, as it reflects a longer aggregation of market data.
Trading software allows simultaneous display of several timeframes in grid layouts. A trader might use a weekly chart to identify primary support and resistance zones, a daily chart to refine structure, and an intraday chart to determine precise entry timing. This hierarchical process promotes clarity and reduces the risk of acting on incomplete context.
Synchronized charting functions permit coordinated navigation. When scrolling through historical price action on one chart, linked windows update automatically. This makes it easier to analyze how lower-timeframe patterns behaved when higher-timeframe levels were tested previously.
Volume Analysis and Order Flow Integration
Volume adds depth to support and resistance evaluation. Trading software frequently integrates traditional volume bars, volume profile, and in some cases order flow tools.
Volume profile differs from standard volume indicators by plotting traded volume at specific price levels. High-volume nodes often correspond with significant support or resistance because they mark areas of concentrated transaction activity. When price revisits those zones, traders analyze whether acceptance or rejection occurs.
More specialized platforms provide depth-of-market displays that reveal pending buy and sell orders. Large clusters of resting orders around a price level may reinforce its short-term importance. However, order book data can change rapidly, limiting its reliability beyond very short time horizons.
Alerts and Conditional Monitoring
Continuous chart observation is not always practical. Trading software addresses this limitation with customizable alert systems. Traders can configure notifications for specific price levels, percentage moves, or indicator crossovers.
Alerts may trigger when price touches support, closes above resistance, or trades within a predefined zone. Notifications are typically delivered through desktop platforms, email, or mobile applications. This reduces the need for constant manual supervision and supports disciplined preparation.
Conditional logic can further refine monitoring. For example, a trader may request an alert only if price breaks resistance with above-average volume. By combining multiple parameters, platforms enable precise filtering of relevant events.
Backtesting and Historical Evaluation
Historical testing is an essential component of structured trading. Many platforms provide strategy testing modules that evaluate support and resistance rules against past data.
A simple approach might involve entering long trades after bullish confirmation at daily support and placing stops below the level. By coding these criteria, traders can analyze metrics such as win rate, maximum drawdown, and average return relative to risk. Scriptable environments allow further customization, including trailing stops or position scaling.
While backtesting offers valuable statistical perspective, it does not ensure future performance. Market conditions, volatility regimes, and liquidity profiles evolve. Nevertheless, testing helps reveal whether a method has demonstrated structural viability across varied historical periods.
Risk Management Integration
Support and resistance analysis must be paired with systematic risk control. Trading software simplifies this integration. Position-sizing calculators determine trade volume based on predefined risk percentages of account equity.
When trading near support, a stop-loss order is commonly set below the level to limit downside exposure if the zone fails. Platforms that provide drag-and-drop order placement allow quick visual adjustment. Risk-to-reward ratios update automatically as levels are modified.
Advanced order types include trailing stops, partial position closures, and conditional entries. If resistance breaks decisively, a trailing mechanism can secure unrealized gains while allowing continued exposure. The automation of these functions reduces execution error and ensures adherence to predefined risk parameters.
Algorithmic Detection and Artificial Intelligence
Recent developments in trading software involve algorithmic and machine learning techniques aimed at identifying statistically meaningful price zones. These systems process extensive historical datasets to locate recurring reaction areas.
Adaptive algorithms may widen support or resistance zones during high volatility and narrow them during stable periods. Such flexibility reflects changing liquidity conditions. However, understanding model transparency remains important. Traders should know whether the system relies on historical pivots, volatility bands, or probabilistic clustering before incorporating its outputs into decision frameworks.
Artificial intelligence tools can rapidly scan multiple markets simultaneously, identifying assets approaching significant structural areas. While this enhances efficiency, independent verification through manual chart review strengthens analytical discipline.
Market-Specific Considerations
Different asset classes exhibit varying behaviors around key levels. Equity markets can respond sharply to corporate earnings reports or regulatory announcements. Futures contracts may react to macroeconomic indicators. Foreign exchange pairs frequently shift direction following central bank commentary. Digital asset markets often display extended trading hours with variable liquidity profiles.
Most trading software integrates economic calendars and market news feeds. By overlaying scheduled events onto charts, traders can assess whether a technical level is likely to face heightened volatility. This contextual awareness supports more informed positioning decisions.
Psychological and Behavioral Dimensions
Support and resistance reflect collective human behavior. Traders tend to anchor expectations to previous highs and lows. When price returns to these points, memory influences order placement. Trading software makes these psychological reference zones visually persistent, reinforcing their relevance.
Round numbers also play a role. Levels ending in zeros or fifties often attract attention due to cognitive simplicity. Platforms allow quick identification of these intervals by adjusting grid settings or chart scaling.
Maintaining objectivity remains essential. Over-interpretation of minor price fluctuations can lead to excessive marking of insignificant levels. A structured methodology, consistently applied within the software environment, reduces analytical distortion.
Maintaining Analytical Discipline
Although trading platforms provide numerous analytical options, clarity should remain a priority. Using too many overlapping indicators may obscure rather than clarify structural levels. Establishing predefined criteria for valid support or resistance—for example, requiring multiple touches with defined volume characteristics—promotes consistency.
Regular trade review enhances performance analysis. Most software maintains detailed execution logs. Exporting and studying this data reveals how price behaved at marked levels and whether risk parameters were respected. Over time, such review supports incremental refinement of methodology.
Limitations of Software-Based Analysis
Despite technological advancement, uncertainty cannot be eliminated. Support and resistance are interpretive tools rather than predictive guarantees. Unexpected macroeconomic developments, liquidity disruptions, or structural shifts may cause levels to fail.
Data quality and platform stability are additional considerations. Delayed feeds or incorrect time zone configurations can alter chart perception. Reliable infrastructure is therefore a prerequisite for accurate evaluation.
Ultimately, trading software enhances analytical efficiency but depends on informed human oversight. Its outputs require contextual interpretation.
Conclusion
Employing trading software to track support and resistance integrates foundational technical theory with scalable analytical tools. Modern platforms provide manual drawing features, automated indicators, multi-timeframe synchronization, volume analytics, alert systems, backtesting modules, and integrated risk controls. These capabilities increase structural consistency and operational efficiency.
Support and resistance persist as central elements of market analysis because they represent aggregated supply and demand dynamics. Trading software refines the process of identifying and managing these zones without altering their conceptual basis. Through disciplined application, consistent methodology, and comprehensive risk management, traders can incorporate software-driven support and resistance analysis into a structured and data-oriented trading framework.